![MAG Annual Report 2020 [EN]](https://finance.mecaer.com/2020en/wp-content/uploads/sites/10/2021/02/MAG2020.png)
Despite the unusual operating conditions caused by the unprecedented current situation, operations continued regularly in 2019/20.
Even when the most restrictive measures were in place, no group operating facilities in Italy or abroad experienced interruptions or suspensions of operations, due to the strategic nature of the aerospace sector and the need to ensure continuity in product support, aircraft maintenance and parts for the military sector and the public administrations in general.
None of the MAG Group companies made recourse to furlough schemes in the various geographical areas1 in which it operates and absenteeism was in line with the average of previous years (see Human resources and safety in the workplace).
During the year, all the group companies not only maintained their employment levels but the overall workforce grew in line with the development plans and in line with the commitments of the development and production programmes.
The year closed with a further increase in volumes, both in terms of total revenue from core business and adjusted revenue, following the curve set out in the 2020 – 2024 plan. The five-year CAGR approximates 2.4%, while the ten years CAGR was 4%.
Operating profit was satisfactory, with an EBITDA of almost €20 million, equal to 13.4% of adjusted revenue and 14.1% of total revenue from core business, an increase on that of the previous year.
The book-to-bill ratio was balanced overall, covering the budget for the current year.
The OEMs rescheduled some of their activities, mostly due to the effect of the temporary closures or slowdowns in activities that some OEMs experienced during the lockdown.
The production plans of the three main customers are expected to stabilise in early 2021, which should offer more precise information for the assessment of the backlog for the 2021 – 2022 two-year period.
Leonardo reported moderate revenue and profitability for its helicopter division for the nine months ended 30 September 20202, and a backlog of some €12.5 billion, in line with 2019 levels and significantly higher than in the previous two years.
Airbus recognised revenues of over €3.6 billion in the first nine months of the year3 for its helicopter division, which is in line with the corresponding period of the previous year, which was slightly higher. The total backlog was for 669 aircraft at 30 September 2020, an increase on the corresponding period of 2019.
Bell Helicopters’, a division of Textron, recognised higher revenue in the first nine months4 of 2020 compared to the corresponding period of the previous year, while the backlog is for some USD5.7 billion, which is in line with that of the third quarter of the previous year.
Overall consolidated revenue for 2019/20 for the MAG Group came to just over €138 million, slightly higher than the €129 million of the previous year.
Revenue in foreign currency was mainly generated in US dollars, totalling USD55.8 million, USD9.5 million of which related to the parent.
Exchange rate trends saw a slight short-term volatility of the US dollar but with averages comparable to 2018/19.
The average US dollar/Euro exchange rate was 1.1203 (1.1281 in 2018/19), with a low of 1.1987 and a high of 1.0707 confirming the short-term volatility.
The average exchange rate for the Canadian dollar was 1.5069, compared to 1.4966 in the previous year, with a low of 1.5898 and a high of 1.4281.
The division of the group’s operations into two operating segments, or Strategic Business Units was maintained during the year:
- Aircraft Systems (“ASY”), whose product lines include safety-critical systems, specifically landing gear, flight controls, actuators, dampening and hydraulic systems; and
- Aircraft Services (“ASE”),which includes the Cabin Comfort Systems (“CCS”) business line, which offers technological/functional cabin comfort systems co-designed with OEMs, and the Aircraft Services (“AS”) business line, which comprises a range of interiors (including customised), reconfiguration, maintenance and repair services.
The following table summarises total revenue from the core business5 during the year, analysed by the operating segments within the two SBUs, which is how the group is structured. Additional information on revenue by operating and geographical segments is given in the notes to the consolidated financial statements:
| [thousands of Euros or percentages] | 2019/2020 | 2018/2019 | 2017/2018 | 2016/2017 | |
|---|---|---|---|---|---|
| Flight control systems and mechanical parts | 29.884 | 36.861 | 26.802 | 24.262 | |
| Retractable landing and other hydraulic systems | 43.050 | 37.026 | 26.900 | 28.166 | |
| Other products and mechanical processing | 1.616 | 1.508 | 949 | 1.217 | |
| Hydraulic systems product support | 9.499 | 5.457 | 6.101 | 10.966 | |
| Engineering | 4.541 | 3.598 | 4.574 | 3.011 | |
| ASY | Total Aircraft Systems | 88.590 | 84.449 | 65.325 | 67.622 |
| Interior and non-structural components | 3.464 | 2.138 | 2.594 | 2.742 | |
| Completion of interiors with the supply of kits | 20.335 | 20.893 | 14.646 | 15.286 | |
| Total Cabin Comfort Systems (“CCS”) | 23.800 | 23.031 | 17.240 | 18.028 | |
| Interior services | 5.041 | 6.014 | 4.592 | 4.869 | |
| Overhaul and maintenance of aircraft and components | 20.716 | 15.659 | 10.207 | 13.854 | |
| Total Services (“AS”) | 25.756 | 21.674 | 14.799 | 18.723 | |
| ASE | Total Aircraft Services | 49.555 | 44.705 | 32.039 | 36.751 |
| Group total | 138.145 | 129.154 | 97.363 | 104.373 |
In terms of turnover, the Aircraft Systems segment performed in line with the previous year, with a slight increase placing the 2019/20 actual figures in line with historic highs.
Production of the M345 programme also commenced in 2020, with the delivery of six complete series by 30 September 2020.
After a challenging period, Aircraft Service recorded an increase in volumes for the second year in a row, with a strong contribution of aircraft MRO activities which in recent years were subject to initiatives to streamline and reduce timeframes, enabling an increase in production capacity and, therefore, revenue. Revenue of the Cabin Comfort business line was substantially in line with that of 2018/19, as it was penalised by the delay in deliveries of some interiors due to the lockdown, which made acceptance by the end customers difficult.
Overall performance reflects these trends, with operating profit higher than that of the previous year and back up to the group’s highest levels, even when the effects of the initial application of IFRS 16 are eliminated.
The financial figures and indicators are usually normalised by eliminating non-recurring or exceptional items which do not relate to operations.
The following table sets out the main components identified on the basis of materiality and their effects on revenue (“R”), EBITDA and EBIT (defined in the following section; see Alternative (“NON IFRS”) performance ratios):
| (thousands of Euros) | R | EBITDA | EBIT |
|---|---|---|---|
| Prior year income, grants and other non-operating revenue | 729 | 729 | 729 |
| Accrual to the product warranty provision | (988) | - | |
| Specific write-downs of inventories, other adjustments | (552) | (905) | (905) |
| Non-recurring health emergency (Covid-19) expense; prior year expense | - | (648) | (648) |
| Total net non-recurring income/(expense) – R/EBITDA | 177 | (1.812) | |
| Non-recurring impairment losses on items of property, plant and equipment (airfields) | (2.500) | ||
| Non-recurring impairment losses on items of intangible assets (M345 and B429) | (2.939) | ||
| Total net non-recurring income/(expense) – EBIT | (6.263) |
As described in greater detail in the notes to the financial statements, the reversal of the product warranty provision relates to the agreement with the customer Leonardo for the retrofit of a hydraulic system, discussed in previous years. This programme was almost completed during the year.
On the other hand, the group has accrued an approximate €600 thousand corresponding to the estimated cost to retrofit the configuration of some M345s systems delivered as pre-serial items. Although non-recurring, this is considered an operating cost.
Specific write-downs of inventories relate to a group of parts identified at risk of economic and technical obsolescence. They have either been written off or written down using higher depreciation rates, based on the statistical analysis criteria that make up group policy.
Impairment losses on non-current assets which impact net operating profit (loss) are of a non-recurring nature and reflect the results of the recoverability analysis (worst, average or best) which identified some recoverability issues. The carrying amounts of the corresponding assets have thus been adjusted to more prudent parameters. Reference should be made to the notes to the financial statements for information on the development programmes in the relevant section of this report on Development of new products.
The normalisation of the aggregates and indicators for the reporting period is shown in the following table:
(thousands of Euros)
| R | EBITDA | EBIT | |
|---|---|---|---|
| Pre-adjustment | 147,007 | 17,964 | 5,411 |
| Normalisation items | (177) | 1,812 | 6,463 |
| Normalised amount | 146,830 | 19,776 | 11,874 |
As in previous years, the following table summarises the profitability indicators:
| [thousands of Euros or percentages] | 2019/20 | % of R’ | 2018/19 | % of R’ | 2017/18 | % of R’ | 2016/17 | % of R’ |
|---|---|---|---|---|---|---|---|---|
| TR – Total revenue from core business | 139.186 | 129.154 | 97.363 | 104.373 | ||||
| Adjusted revenue – R | 146.830 | 135.574 | 108.827 | 108.492 | ||||
| Adjusted EBITDA | 19,776 | 13.5% | 16.054 | 11,8% | 9.427 | 8,7% | 9.812 | 9,0% |
| Adjusted EBIT | 11,874 | 8,1% | 11.540 | 8,5% | 4.225 | 3,9% | 4.706 | 4,3% |
| Profit for the year | 7,603 | 5.2% | 5,649 | 4.2% | 2,700 | 2.5% | 2,659 | 2.5% |
Certain indicators (Adjusted EBITDA and Adjusted EBIT) were impacted by the initial application of IFRS 16, as described in greater detail in the notes to the consolidated financial statements.
These effects are summarised in the following table:
| [thousands of Euros or percentages] | 2019/20 (pre-IFRS 16) | Effects of IFRS 16 | 2019/20 reported figures |
|---|---|---|---|
| TR – Total revenue from core business | 139,186 | - | 139,186 |
| Adjusted revenue – R | 146,830 | - | 146,830 |
| Adjusted EBITDA | 17,382 | 2,394 | 19,776 |
| Adjusted EBIT | 11,690 | (16) | 11,674 |
Profitability indicators, net of the effects of the initial application of IFRS 16, are summarised in the following table:
| [thousands of Euros or percentages] | 2019/20 | % of R’ | 2018/19 | % of R’ | 2017/18 | % of R’ | 2016/17 | % of R’ |
|---|---|---|---|---|---|---|---|---|
| TR – Total revenue from core business | 139,186 | 129,154 | 97,363 | 104,373 | ||||
| Adjusted revenue – R | 146,830 | 135,574 | 108,827 | 108,492 | ||||
| Adjusted EBITDA | 17,382 | 11.8% | 16,054 | 11.7% | 9,427 | 8.7% | 9,812 | 9.0% |
| Adjusted EBIT | 11,690 | 8.0% | 11,540 | 8.5% | 4,225 | 3.9% | 4,706 | 4.3% |
Profitability grew in absolute terms, and was steady in percentage terms. The difference between total revenue and revenue remained tight and decreased on a percentage basis. This trend is linked to the lower capitalisation of development costs, although the slowdown in certain helicopter deliveries in the ASE segment during the year impacted a large amount of the contract assets.
The group’s medium-term target is to maintain operating profit (EBIT) at or higher than 8%.
Given the increasing weight of the amortisation of development costs, this objective will be met by improving the gross operating profit of the various business lines and an adequate use of the production capacity available at the main facilities.
The net financial income was significantly impacted by the €3.9 million gain realised on the sale of the investee Vertex Aero. The other captions were substantially in line with the previous year, with a slight improvement in interest and financial expense, thanks to the maintenance of financial debts similar to 2018/19 levels and on-the-whole favourable and stable interest rates.
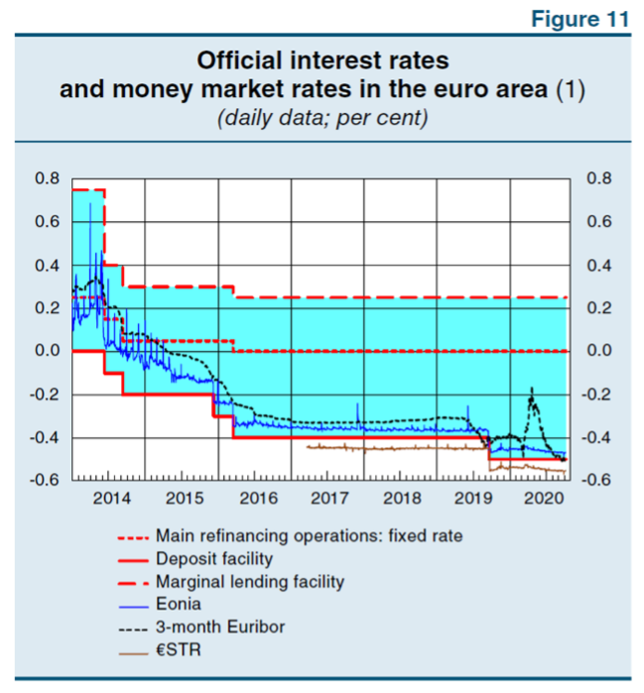
The European Central Bank’s monetary policy stance continued to be accommodative after the change of leadership to Ms. Lagarde. If anything, it intensified in the second half of the year to combat the effects of the health emergency, supporting liquidity and borrowing conditions in the economy and the availability of credit to households and businesses.
The expanded asset purchase programmes (APP) were intensified during the year, and the pandemic emergency purchase programme (PEPP) commenced.6
The group’s policy is aimed at maintaining a balance between non-current sources and applications of funds.
The group’s investment in new product development has tended to decrease in recent years (€3,384 thousand) and capitalised development expense is less than 3% of revenue. In a situation where development spending is high, this phenomenon is due to the increase in the portion of activities covered by non-recurring revenue from customers.
The section on research and development activities (see Development of new products) also includes detailed information on the main projects and their funding, given that certain projects have received government assistance to support innovation. Investments are essential to create and maintain a competitive edge and ensure continued growth above the market average levels of comparable competitors.
Current non-financial assets rose slightly, especially inventories (+€7,838 thousand) in relation to both the increase in activity volumes and the current economic context which made it advisable to keep high levels of some inventory categories.
The trend in current assets was also the result of an increase in trade payables (+€6,376 thousand).
Without the impact of the initial application of IFRS 16, closing net financial debt further improved on the previous year end, with an overall decrease of €2,283 thousand. Non-current debt accounts for a large portion of net financial debt.
| [in thousands of Euros] | 2018/2019 | 2018/2019 | 2018/2018 | 2016/2017 |
|---|---|---|---|---|
| NFD (carrying amount) | 27.353 | 22.936 | 26.110 | 29.092 |
| IFRS 16 impact | (6.700) | - | - | - |
| NFD (without IFRS 16 impact) | 20.653 | 22.936 | 26.110 | 29.092 |
Additional details on the composition of net financial debt are provided in the notes.
| [in thousands of Euros] | 30/09/2020 | 30/09/2019 | 30/09/2018 | 30/09/2017 |
|---|---|---|---|---|
| A- NET NON-CURRENT ASSETS | 56.781 | 67.214 | 43.751 | 37.965 |
| B- NET CURRENT ASSETS | 46.743 | 45.961 | 48.873 | 56.799 |
| C- POST EMPLOYMENT BENEFITS AND PROVISIONS | (8.333) | (9.766) | (10.212) | (11.422) |
| D- INVESTED CAPITAL | 95.191 | 103.409 | 82.412 | 83.342 |
| E- EQUITY | 67.838 | 63.573 | 56.302 | 54.250 |
| F- NET FINANCIAL DEBT | 27.353 | 39.836 | 26.110 | 29.092 |
| G- TOTAL AS IN D | 95.191 | 103.409 | 82.412 | 83.342 |
As in previous years, the following table shows financial and mixed ratios:
- The debt to equity ratio, based on reported equity, which shows the balance between the sources of capital (venture capital and equity), and the amount of financial leverage.
- The debt to EBITDA ratio, which indicates the group’s debt repayment potential using operating profit.
- Some liquidity ratios that show the balance between short-term sources and application of funds.
To facilitate comparability with previous years, the financial ratios for 2019/20 are shown without the effects of IFRS 16 (a) and using the carrying amounts inclusive of the effects of the new accounting standard (p).
| 2019/20 p | 2019/20 a | 2018/2019 | 2017/2018 | 2016/2017 | |
|---|---|---|---|---|---|
| DEBT TO EQUITY | 0.40 | 0.30 | 0.36 | 0.46 | 0.54 |
| DEBT TO ADJUSTED EBITDA | 1.38 | 1.21 | 1.43 | 2.77 | 2.96 |
| 30/09/2020 | 30/09/2019 | 30/09/2018 | 30/09/2017 | |
|---|---|---|---|---|
| CURRENT RATIO | 1.82 | 1.89 | 1.97 | 2.04 |
| ACID TEST RATIO | 0.82 | 0.81 | 0.91 | 1.06 |
The only exception was the Vergiate (VA) facility located at the Leonardo site, which operates as a finishing centre for the LHD aircraft, where some hours of furlough (2,127 hours between 16 March and 28 July 2020) were required to align with the customer’s activities. ↩
Leonardo, Results at 30 September 2020, p. 5. ↩
Airbus. Unaudited Condensed Interim IFRS Consolidation Financial Information for the nine-month period ended 30 September 2020. See also Airbus, “9m 2020 Results”, slides 13/34. ↩
Textron. Q3-2020 form 10k, 30 September 2020, Note 12, 13 Segment Information. ↩
The caption does not include revenue from contracts with customers which were classified as changes in contract work in progress in reporting periods prior to the initial application of IFRS 15 in 2018/19. ↩
Bank of Italy, Economic Bulletin no. 4/2019, October 2019. ↩