![MAG Annual Report 2020 [EN]](https://finance.mecaer.com/2020en/wp-content/uploads/sites/10/2021/02/MAG2020.png)
The following graphs give a summary of the main financial and non-financial performance indicators, which have been selected to paint an overall picture of the group in its entirety (in millions of Euros, units or percentages).
REVENUE BY OPERATING SEGMENT
REVENUE (%) BY MARKET SEGMENT
REVENUE (%) BY GEOGRAPHICAL SEGMENT
PERFORMANCE1
HUMAN RESOURCES2
R&D EXPENDITURES3
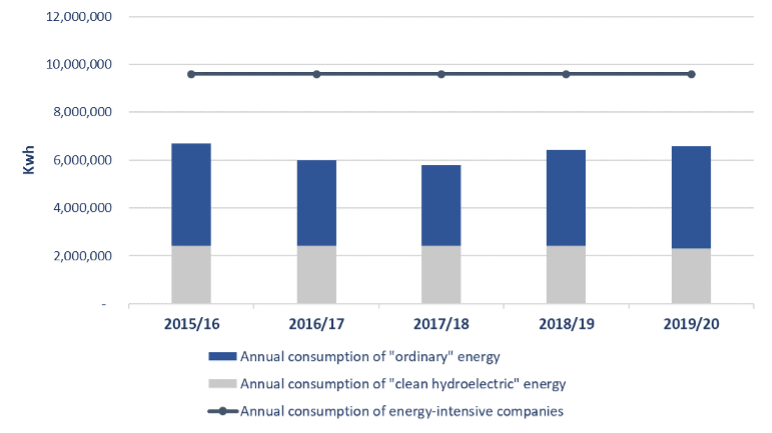
ELECTRICAL POWER CONSUMPTION
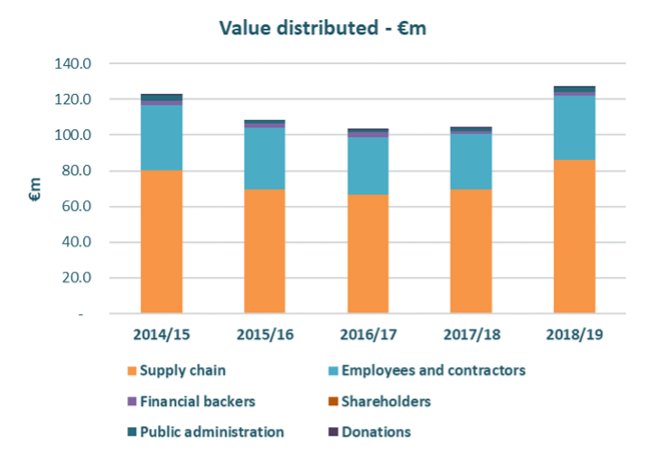
SHARED CREATED VALUE
The section on the group’s performance and financial position includes information on the performance of the main group companies (see HIGHLIGHTS OF MAIN CONSOLIDATED COMPANIES), while the notes to the consolidated financial statements include equity information on the main group companies.
For the definition of adjusted EBITDA and adjusted EBIT, see the Errore. L’origine riferimento non è stata trovata. section in the Errore. L’origine riferimento non è stata trovata. ↩
Contractors include those hired under staff leasing contracts pursuant to Italian law and contractors or temporary workers in Canada and the United States (see Errore. L’origine riferimento non è stata trovata. RESOURCES AND SAFETY IN THE WORKPLACE). ↩
The data refer to total spending for applied research and development, including the amount funded directly by the group and the amount funded by revenue from customers or grants/assistance. ↩