![MAG Annual Report 2020 [EN]](https://finance.mecaer.com/2020en/wp-content/uploads/sites/10/2021/02/MAG2020.png)
Supplementary disclosure to the financial data describes how the economic value generated is allocated to stakeholders.
To this end, economic value means the total wealth created by MAG, based on the GRI1 definition in a manner consistent with objectively measurable indicators in accordance with the relevant standards of accounting and financial practice.

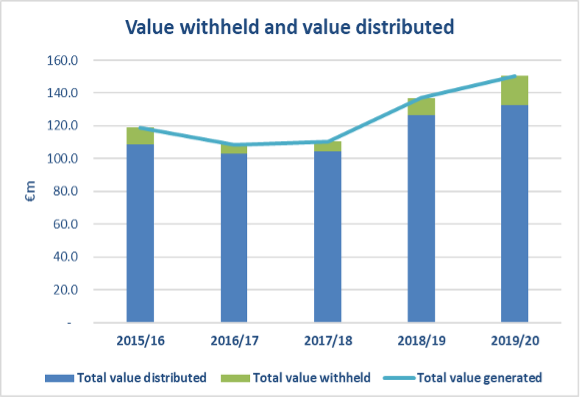
However, economic value is also shown divided into value distributed and value withheld, constituting the breakdown of value among the various stakeholders (suppliers, the workforce, the financial community, shareholders, the public administration and the community):
| Economic value generated by the group | 2019/20 | 2018/19 | 2017/18 | 2016/17 | 2015/16 |
|---|---|---|---|---|---|
| Revenue from core business | 138.145 | 129.154 | 97.363 | 104.373 | 116.567 |
| Other revenue and components of revenue | 7.728 | 6.449 | 11.246 | 3.432 | 1.471 |
| Other income | 1.134 | 756 | 1.286 | 687 | 534 |
| Financial income | 3.710 | 899 | 231 | 873 | 503 |
| Exchange gains or losses | (197) | (188) | 298 | (760) | (68) |
| Total economic value generated | 150.520 | 137.070 | 110.424 | 108.605 | 119.007 |
| Economic value distributed by the group | |||||
| Suppliers | 90.494 | 86.253 | 69.491 | 66.634 | 69.758 |
| Workforce | 38.521 | 35.793 | 31.190 | 32.095 | 34.278 |
| Financial community | 1.823 | 2.103 | 1.641 | 2.713 | 2.381 |
| Shareholders | - | - | - | - | - |
| Public administration | 2.012 | 2.615 | 1.932 | 1.745 | 2.267 |
| Donations | 28 | 15 | 20 | 8 | 7 |
| Total economic value distributed | 132.878 | 126.779 | 104.274 | 103.195 | 108.691 |
| Economic value withheld by the group | |||||
| Amortisation and depreciation | 8.098 | 4.514 | 4.763 | 4.767 | 4.636 |
| Provisions | 2.033 | 128 | (1.313) | (2.013) | 2.867 |
| Reserves | 7.511 | 5.649 | 2.700 | 2.656 | 2.813 |
| Total economic value withheld | 17.642 | 10.291 | 6.150 | 5.410 | 10.316 |
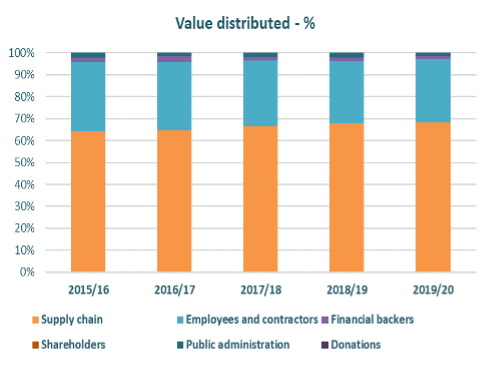
The structure of distributed value highlights the numerical significance of wealth creation from the economic process carried out by the group’s business activities.
The most significant component is suppliers, which refers to the supply chain, i.e., the chain of companies whose operations support the group’s economic process and which are a strategic part of the business model.
Another significant component is the employees and contractors who are the biggest driver via their expertise and labour.
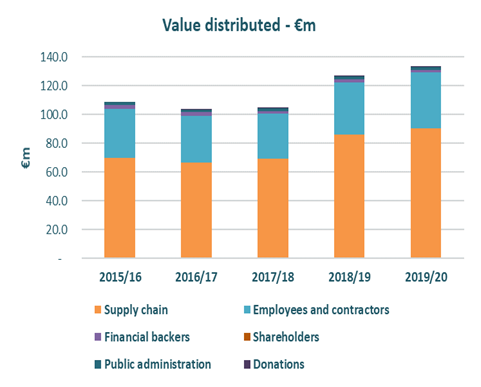
The distribution of economic value to the public administration is made up of the amount of current taxes paid. It theoretically represents the remuneration of services, infrastructures and the community in general.
Dividends have not been distributed to date, as earnings are withheld within the group as value allocated to support future development strategies.
It could be said that shared value can be measured as the amount of value generated from which the stakeholders benefit.
Global Reporting Initiative ↩