Revenue increased significantly in 2018/19, returning to the usual growth levels after the disruption experienced by the civil helicopter market in the 2016 – 2018 period.
Specifically, revenue from core business rose by 32% over the previous year, taking the five-year CAGR back to around 5.8%.
The impact on operating profit is the result of a slight improvement in gross operating profit (+0.3%) and the volume effect (+2.8%).
The recovery of volumes was accompanied by a growing orders trend, resulting in a backlog which ensures a significant coverage of the budget for the current year and extends to later years of the business plan.
The book-to-bill ratio was thus balanced at year end, generally due to the conditions of the main helicopter OEMs.
Leonardo reported an increase in revenue and profitability for its helicopter division in the first nine months of 20191, and a large backlog in line with 2018 levels that is significantly higher than in the previous two years.
Airbus recognised revenue of more than €3.7 billion in the first nine months of the year2 for its helicopter division, an increase of some 7% in profitability of this segment, with a backlog which remains strong after picking up sharply in 2018. The total backlog for 20193 was 413 aircraft, compared to the 356 delivered in 2018.
Bell Helicopters’ Textron division recognised slightly higher revenue in the first nine-months4 of 2019 compared to the corresponding period of the previous year. Available backlog figures5 for 2019 are significantly higher than those of the previous year end at approximately USD5.8 billion.
Consolidated revenue for 2018/19 came to €129 million, compared to €97 million in the previous year.
Revenue in foreign currency was mainly generated in US dollars and totalled USD 52.3 million, USD12.6 million of which related to the parent.
Exchange rate trends saw a slight appreciation of the US dollar against the Euro and a more significant strengthening of the Euro over the Canadian dollar.
The average US dollar/Euro exchange rate was 1.1281 (1.1932 in 2017/18), with a low of 1.1606 and a high of 1.0889 – precisely on 30 September 2019 – confirming the short-term volatility.
The average exchange rate for the Canadian dollar was 1.4966, compared to 1.5273 in the previous year, with a low of 1.5605 and a high of 1.4426, also on 30 September.
The division of the group’s operations into two operating segments, or Strategic Business Units, was consolidated during the year:
- Aircraft SYstems (“ASY”), whose product lines include safety-critical systems, specifically landing gear, flight controls, actuators, dampening and hydraulic systems; and
- Aircraft SErvices (“ASE”),which includes the Cabin Comfort Systems (“CCS”) business line, which offers technological/functional cabin comfort systems co-designed with OEMs, and the Aircraft Services (“AS”) business line, which comprises a range of interiors (including customised), reconfiguration, maintenance and repair services.
The table below breaks down total revenue from core business by the operating segments. Additional information on revenue by operating and geographical segments is given in the notes to the consolidated financial statements (see 3.4 SEGMENT REPORTING):
| thousands of Euros or percentages | 2018/2019 | 2017/2018 | 2016/2017 | 2015/2016 | |
|---|---|---|---|---|---|
| Flight control systems and mechanical parts | 36.861 | 26.802 | 24.262 | 25.885 | |
| Retractable landing and other hydraulic systems | 37.026 | 26.900 | 28.166 | 29.234 | |
| Other products and mechanical processing | 1.508 | 949 | 1.217 | 1.013 | |
| Hydraulic systems product support | 5.457 | 6.101 | 10.966 | 8.049 | |
| Engineering | 3.598 | 4.574 | 3.011 | 4.977 | |
| ASY | Totale Aircraft Systems | 84.449 | 65.325 | 67.622 | 69.158 |
| Interior and non-structural components | 2.138 | 2.594 | 2.742 | 5.830 | |
| Completion of interiors with the supply of kits" | 20.893 | 14.646 | 15.286 | 20.638 | |
| Totale Cabin Comfort Systems ('CCS') | 23.031 | 17.240 | 18.028 | 26.468 | |
| Interior services | 6.014 | 4.592 | 4.869 | 8.215 | |
| Overhaul and maintenance of aircraft and components | 15.659 | 10.207 | 13.854 | 12.726 | |
| Total Services ('AS') | 21.674 | 14.799 | 18.723 | 20.941 | |
| ASE | Total Aircraft Services | 44.705 | 32.039 | 36.751 | 47.409 |
| Group total | 129.154 | 97.363 | 104.373 | 116.567 | |
In terms of turnover, the ASY segment performed positively, with activity levels once again in line with those of the long-term cycle and an adequate utilisation of the production capacity. The increase in flight control systems activity is due both to the recovery in orders on existing programmes and to the expansion of the production range, especially for the Bell B505 programmes.
The performance of the ASE segment reflects both the uptick in sales of interiors systems and components and the improvement in the services component, both for outfitting and completion and for maintenance and repairs. The Italian facilities operate as service stations for various types of aircraft and have implemented an initiative to streamline and reduce timeframes, leading to greater potential production using the same resources.
Overall performance reflects these trends, with operating profit significantly higher than that of the previous year and back up to the group’s usual levels.
The financial figures and indicators are normalised by eliminating non-recurring or exceptional items which do not relate to operations, as shown in the table below, showing the impact on revenue and EBITDA:
| Descrizione | TOT | Ebitda | |
|---|---|---|---|
| Prior year income, grants and gains on disposals | 449 | 449 | |
| Tax assets pertaining to previous years | 336 | 336 | |
| Accrual to the product warranty provision | - | (1.917) | |
| Specific write-downs of inventories | - | (439) | |
| Prior year expense | - | (123) | |
| Transazioni ed altri oneri | (62) | - | (62) |
| net non-recurring income/(expense) | 785 | (1.756) |
As described in greater detail in the notes to the consolidated financial statements, the non-recurring accrual to the product warranty provision relates to the agreement with the customer Leonardo for the retrofit of a hydraulic system, discussed in previous years. Although MAG is not technically responsible for the system not meeting specifications, the agreement was reached in the context of the longstanding relationship with the customer which MAG deems a priority for business continuity.
| thousands of Euros or percentages | 2018/19 | % of R' | 2017/18 | 2016/17 | 2015/16 | |||
|---|---|---|---|---|---|---|---|---|
| TR – Total revenue from core business | 129.154 | 97.363 | 104.373 | 116.567 | ||||
| Adjusted revenue – R | 135.605 | 108.827 | 108.492 | 118.572 | ||||
| Adjusted EBITDA | 16.054 | 11,8% | 9.427 | 8,7% | 9.812 | 9,0% | 14.330 | 12,1% |
| Adjusted EBIT | 11.540 | 8,5% | 4.225 | 3,9% | 4.706 | 4,3% | 6.827 | 5,8% |
| Profit for the year | 5.649 | 4,2% | 2.700 | 2,5% | 2.659 | 2,5% | 2.815 | 2,4% |
The group’s medium-term target is to maintain operating profit (EBIT) at or higher than 8%.
Given the increasing weight of the amortisation of development costs, this objective will be met by improving the gross operating profit of the various business lines and an adequate use of the production capacity available at the main facilities.
The net financial expense of €188 thousand was not significantly impacted by exchange rate trends as the exchange gains and losses almost fully offset each other due to the amount of the foreign currency inflows.
Interest and financial expense are substantially in line with the previous year thanks to the maintenance of financial debts at 2017/18 levels and on-the-whole favourable and stable interest rates.
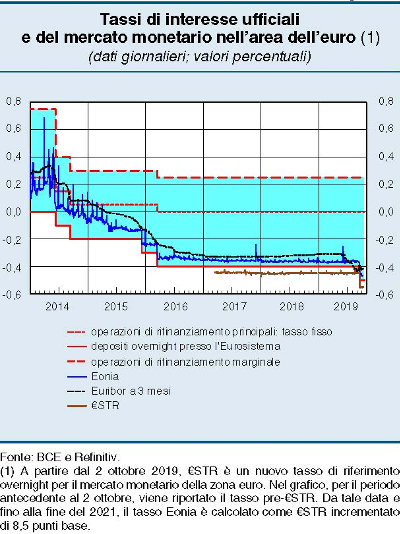
Indeed, the European Central Bank’s accommodating monetary policy continued throughout the year, maintaining an expansionary stance aimed at heading off recessionary and deflationary risks.
All key money market benchmarks for refinancing transactions remain at minimal or negative levels.
The Euribor for all the different maturities also remained under -0.2 percentage points for all of 2019.
The Eurosystem recently decreased its deposit facility rates by ten basis points to -0.5%.6
The group’s financial debt remains steady, with credit facilities totalling €95 million (bank credit facilities of €17 million for cash or advances and credit facilities for trade receivables factoring of €78 million).
At the reporting date, 33% of these facilities were used (2% of the bank credit facilities, 40% of the non-recourse factoring of trade receivables).
Thanks to its credit rating, the group can access credit with the main banking groups at prime rate conditions, while maintaining borrowing costs within satisfactory parameters.
| in thousands of Euros | 2018/2019 | 2017/2018 | 2016/2017 | 2015/16 |
|---|---|---|---|---|
| Interest and other financial income | 28 | 23 | 113 | 364 |
| Net interest/(expense) on discounting | 603 | 203 | (8) | (18) |
| Net exchange gains (losses) | (188) | 298 | (760) | (67) |
| Interest and other financial expense | (1.284) | (1.194) | (1.327) | (1.562) |
| Fees, commissions and other charges | (551) | (442) | (618) | (663) |
| NET FINANCIAL EXPENSE | (1.392) | (1.112) | (2.600) | (1.946) |
| Net of exchange differences and discounting | (1.807) | (1.613) | (1.832) | (1.860) |
These parameters are analysed as part of the group’s financial risk management policy (see 5.3 FINANCIAL RISK MANAGEMENT).
At the reporting date, the group did not hold financial instruments hedging interest rate risk (see 4.2.4 DERIVATIVES).
Turning to the group’s financial position, net non-current assets increased over those of the prior year end due to the continuation of significant investing activities (€10,287 thousand in property, plant and equipment and intangible assets), against amortisation, depreciation, decreases and impairment losses (€7,008 thousand) and a decrease in non-current loans and borrowings (€2,270 thousand).
The group’s policy is aimed at maintaining a balance between non-current sources and applications of funds (see STATEMENT OF CASH FLOWS).
The group continues to invest significantly in the development of new products (these activities increased by €4,796 thousand, net of grants and tax assets), with an impact of roughly 3.7% on revenue from core business. This is high compared to the sector average for innovative companies.
The section on research and development activities (see DEVELOPMENT OF NEW PRODUCTS) also includes detailed information on the main projects and their funding, given that certain projects have received government assistance to support innovation. Investments are essential to create and maintain a competitive edge and ensure continued growth above the market average levels of comparable competitors.
Current non-financial assets rose slightly, especially inventories (+€3,178 thousand) and trade receivables (+€1,626 thousand). This is related to the increase in business volumes, not a deterioration in turnover levels.
The trend in current assets was also the result of an increase in trade payables (+€2,610 thousand) and in other current liabilities (+€2,819 thousand). The latter were impacted by the large contract liabilities linked to the deferred revenue from contracts for engineering activities.
Closing net financial debt further improved on the previous year end, with an overall decrease of €3,175 million to €22,936 thousand, mostly comprised of non-current debt.
Additional details on the composition of net financial debt are reported in the notes to the consolidated financial statements (see 9.1 NET FINANCIAL DEBT).
| in thousands of Euros | 2018/2019 | 2018/2018 | 2016/2017 | 2015/2016 |
|---|---|---|---|---|
| A- NET NON-CURRENT ASSETS | 50.314 | 43.751 | 37.965 | 32.217 |
| B- NET CURRENT ASSETS | 45.961 | 48.873 | 56.799 | 61.471 |
| C- POST EMPLOYMENT BENEFITS AND PROVISIONS | (9.766) | (10.212) | (11.422) | (13.135) |
| D- INVESTED CAPITAL | 87.509 | 82.412 | 83.342 | 80.553 |
| E- EQUITY | 63.574 | 56.302 | 54.250 | 51.665 |
| F- NET FINANCIAL DEBT | 22.936 | 26.110 | 29.092 | 28.888 |
| G- TOTAL AS IN D | 86.509 | 82.412 | 83.342 | 80.553 |
The debt to equity ratio, based on reported equity, reveals a balanced use of sources, showing very contained financial leverage.
The debt to EBITDA ratio indicates that the group’s debt repayment potential using operating profit is adequate.
The table below shows some liquidity ratios that confirm the group’s ability to maintain a suitable balance between short-term sources and application of funds over time:
| FINANCIAL RATIOS | 2018/2019 | 2017/2018 | 2016/2017 | 2015/2016 | ||||
|---|---|---|---|---|---|---|---|---|
| DEBT TO EQUITY | 0,36 | 0,46 | 0,54 | 0,56 | ||||
| DEBT TO ADJUSTED EBITDA | 1,43 | 2,77 | 2,96 | 2,02 | ||||
| LIQUIDITY RATIOS | ||||||||
| RATIO | 2018/2019 | 2017/2018 | 2016/2017 | 2015/2016 | ||||
| CURRENT RATIO | 1,89 | 1,97 | 2,04 | 2,19 | ||||
| ACID TEST RATIO | 0,81 | 0,91 | 1,06 | 1,15 | ||||
Leonardo. Results at 30 September 2019, pp. 8-9. It should be noted that the backlog increased significantly in 2018 with the acquisition of the Qatar NH90 contract. ↩
Airbus. Unaudited Condensed Interim IFRS Consolidation Financial Information for the nine-month period ended 30 September 2019. See also Airbus, “9m 2019 Results” presentation “9-months 2019 Highlights”, slides 5 and 6. ↩
Airbus. “Annual results. Helicopters FY 2018”. ↩
Textron. Q3-2019 form 10k, 30 September 2019, Note 12, 13 Segment Information. ↩
Textron. Annual Report 2018, pp. 16/96, Finance Segment, USD5.8 billion, compared to USD4.6 billion in 2017. ↩
Bank of Italy. Economic Bulletin no. 4/2019, October 2019. ↩